Creating Awesome Infographics
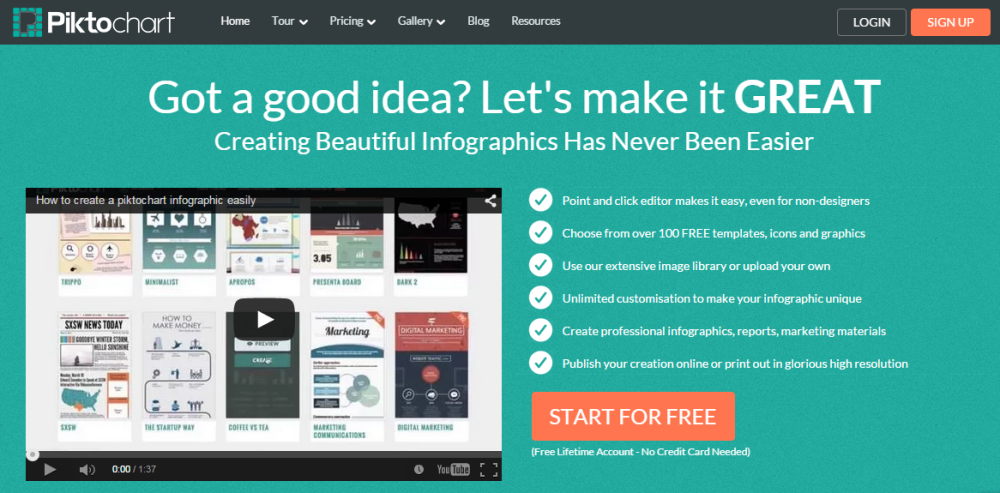
Infographic: ˌinfōˈɡrafik/ (Noun) a visual image such as a chart or diagram used to represent information or data. So, yes, pie charts and venn diagrams are certainly in the infographic field. But, there are snazzier ways of jazzing up an infographic. If you’re not quite as handy at Adobe, but want some gorgeous graphics to send to the board, audience, or funder, try out Piktochart. A few minutes on here and some beautiful things have ...
Thank you for the authoritative read on this issue. To me, being able to actually see the icon in the…