4 Starter Tips for Creating Infographics
Infographics are everywhere right now. A good one is quick to read, gives you the facts and figures clearly, and has some whimsy through the theme or the graphics that are used. Thinking about creating one for your next program book or solicitation letter? Check out this post from Network for Good’s blog by Melissa Raimondi that shares four steps critical to making a successful infographic. Doing some of the research, data mining, and visualizing before ...
Creating Awesome Infographics
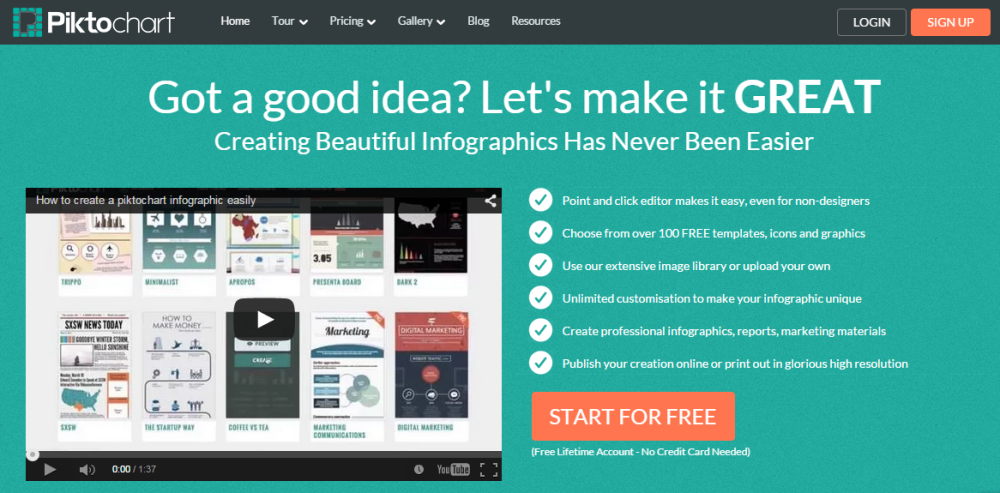
Infographic: ˌinfōˈɡrafik/ (Noun) a visual image such as a chart or diagram used to represent information or data. So, yes, pie charts and venn diagrams are certainly in the infographic field. But, there are snazzier ways of jazzing up an infographic. If you’re not quite as handy at Adobe, but want some gorgeous graphics to send to the board, audience, or funder, try out Piktochart. A few minutes on here and some beautiful things have ...
Thank you for the authoritative read on this issue. To me, being able to actually see the icon in the…