Send Us Your Selfies
By
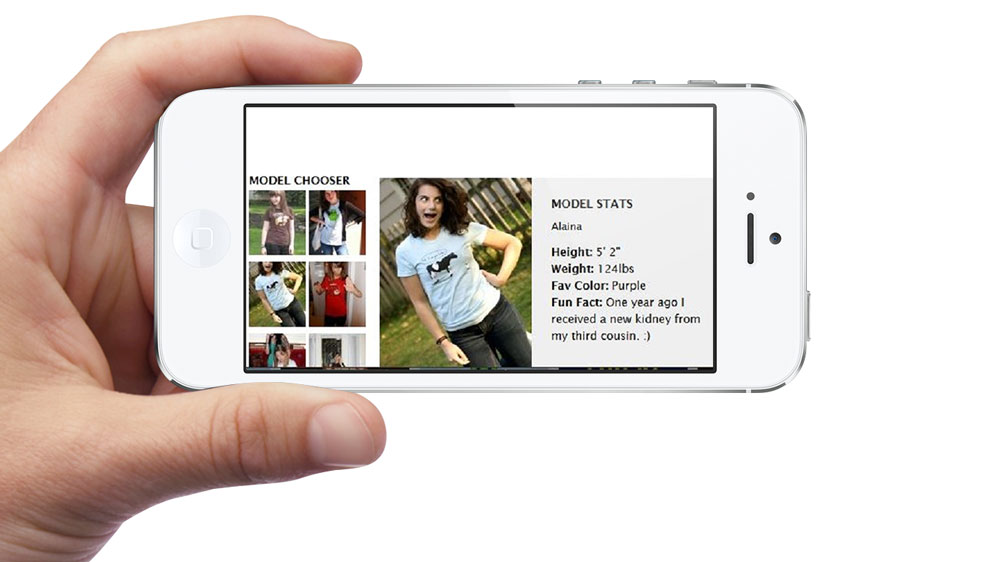
A Place For Selfies Just because you don’t want people taking selfies during a performance doesn’t mean selfies can’t serve a constructive purpose. It is just a matter of channeling the impulse people have to prove they were present somewhere and participating toward a specific goal. In fact, if people are taking selfies in connection with your events, it is likely they aren’t going far enough to suit your needs. A pose with a group ...
Creating Awesome Infographics
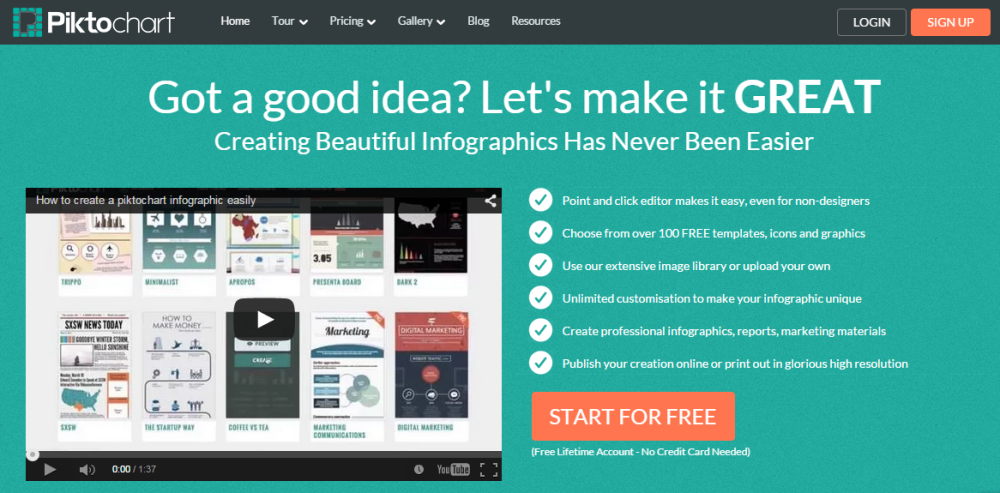
Infographic: ˌinfōˈɡrafik/ (Noun) a visual image such as a chart or diagram used to represent information or data. So, yes, pie charts and venn diagrams are certainly in the infographic field. But, there are snazzier ways of jazzing up an infographic. If you’re not quite as handy at Adobe, but want some gorgeous graphics to send to the board, audience, or funder, try out Piktochart. A few minutes on here and some beautiful things have ...
An Easy Way To Maintain Your Brand Assets
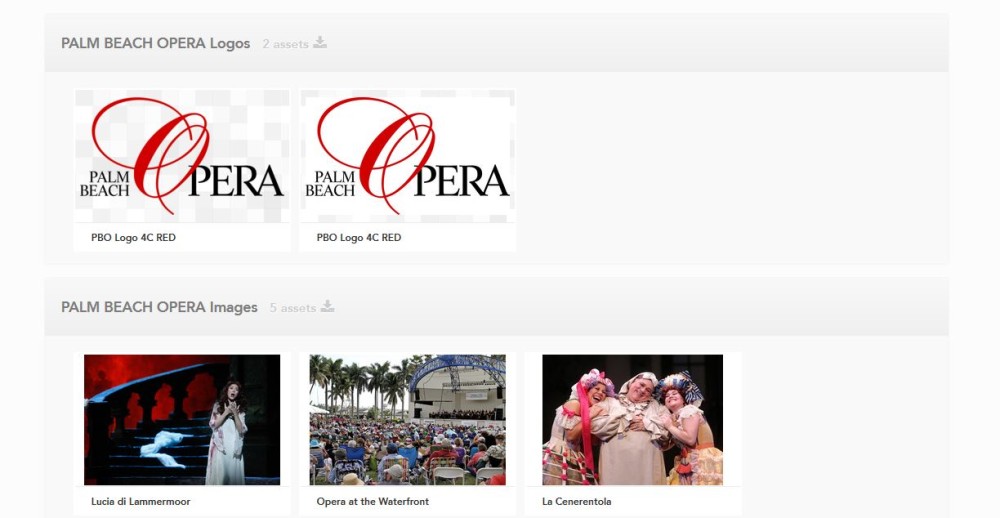
If I had a nickel for every time I was asked to send someone our logo… If you’re in arts marketing, you know what I mean. We all deal with partner organizations, vendors, and designers who need our logo and brand assets and sometimes this can be time consuming to gather everything for them each time. I recently found out about Brandfolder.com which is a place where you can store all of your brand assets and ...
Thank you for the authoritative read on this issue. To me, being able to actually see the icon in the…