Recently, fellow ArtsHacker, Ceci Dadisman, and I enjoyed giving a presentation to attendees of the Institute of Outdoor Theatre 2016 conference on how to use Google Analytics (GA) to make data-driven improvements to website content and layouts.

The session was a huge hit and unlike our other GA oriented sessions over the past year (NAMPC2015 and ArtsMidwest2016), this one focused more on using out-of-the-box GA features, which made the material more readily usable for professionals just getting into GA.
Simply put, if GA seems new and a little scary, this is exactly the place you need to go in order to begin building your skillsets.
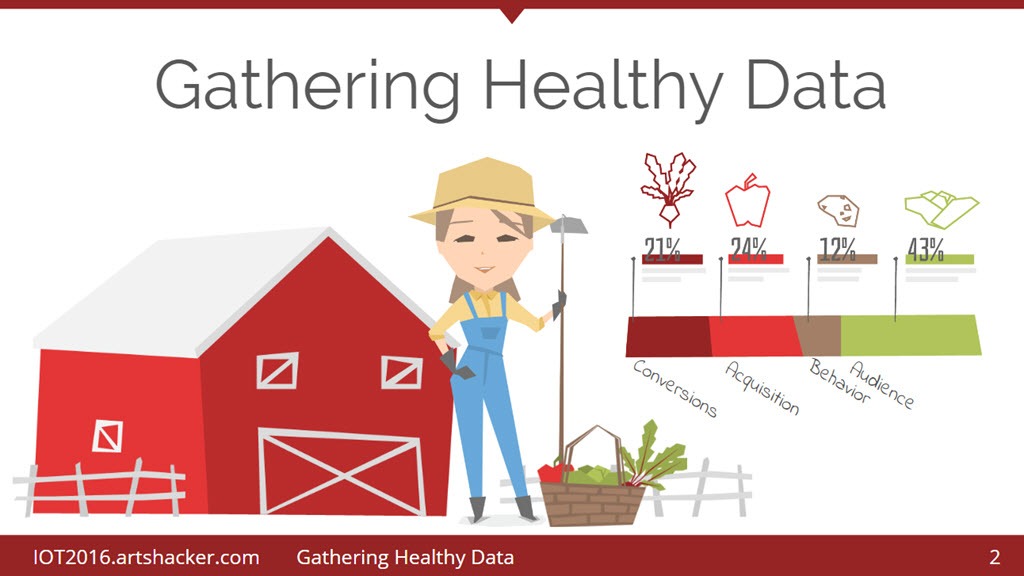
The session was divided into three primary components: Gathering Healthy Data, Turning Data Into Ingredients, and Serving Up Useful Experiences.
[box]
[threecol_one] [/threecol_one] [threecol_one]
 [/threecol_one] [threecol_one_last]
 [/threecol_one_last] [/box]
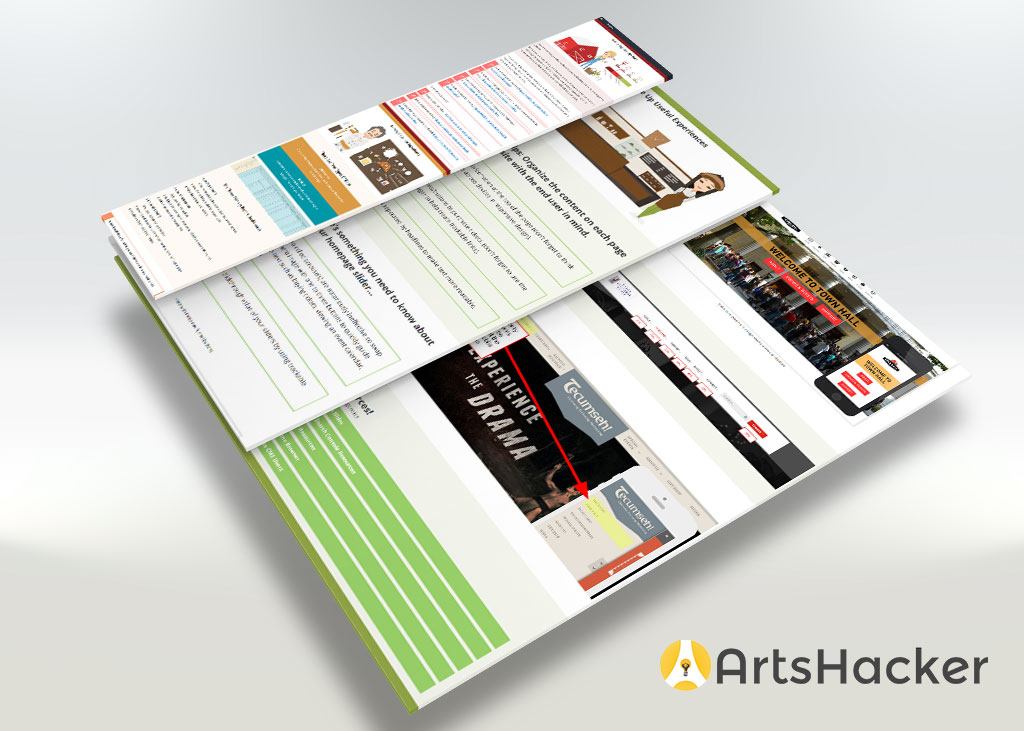
In addition to the presentation slides, we designed a special standalone micro site that series as a superb tutorial all on its own and just like our other presentation oriented microsites, it works wonderfully on mobile and desktop devices.
And it wouldn’t be ArtsHacker if we didn’t share our resources with reader so feel free to stop by the site (sorry, the site is no longer available), read the slides, and share with your colleagues!
