Do you have specific pieces of data that you always want to see when you’re checking your Google Analytics? (Because I know you are checking your Google Analytics regularly, right? Yes. Yes, you are.)
A super handy way to streamline the process is to create a custom dashboard. You can take almost any data set that is in Google Analytics and put it into a dashboard. Let me show you!
Step 1: Login to your GA account and navigate to some data that you regularly look at.
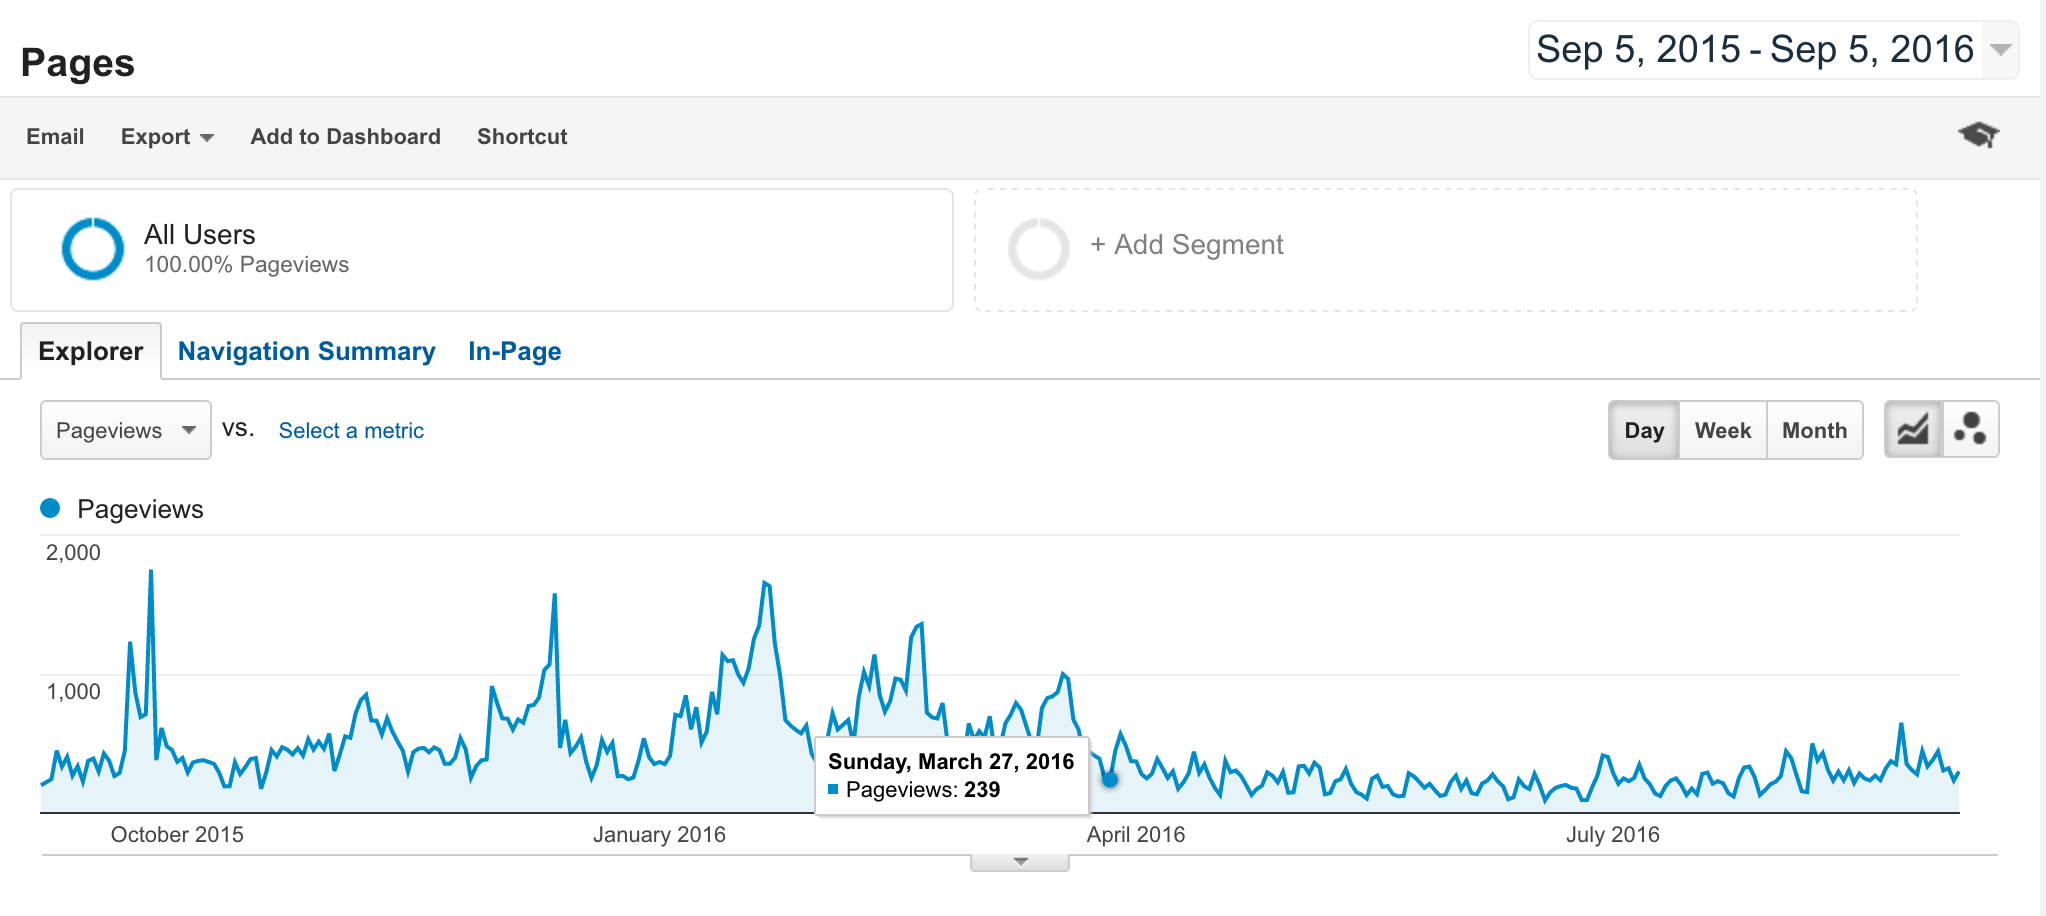
In this example, I’m looking at pageviews.
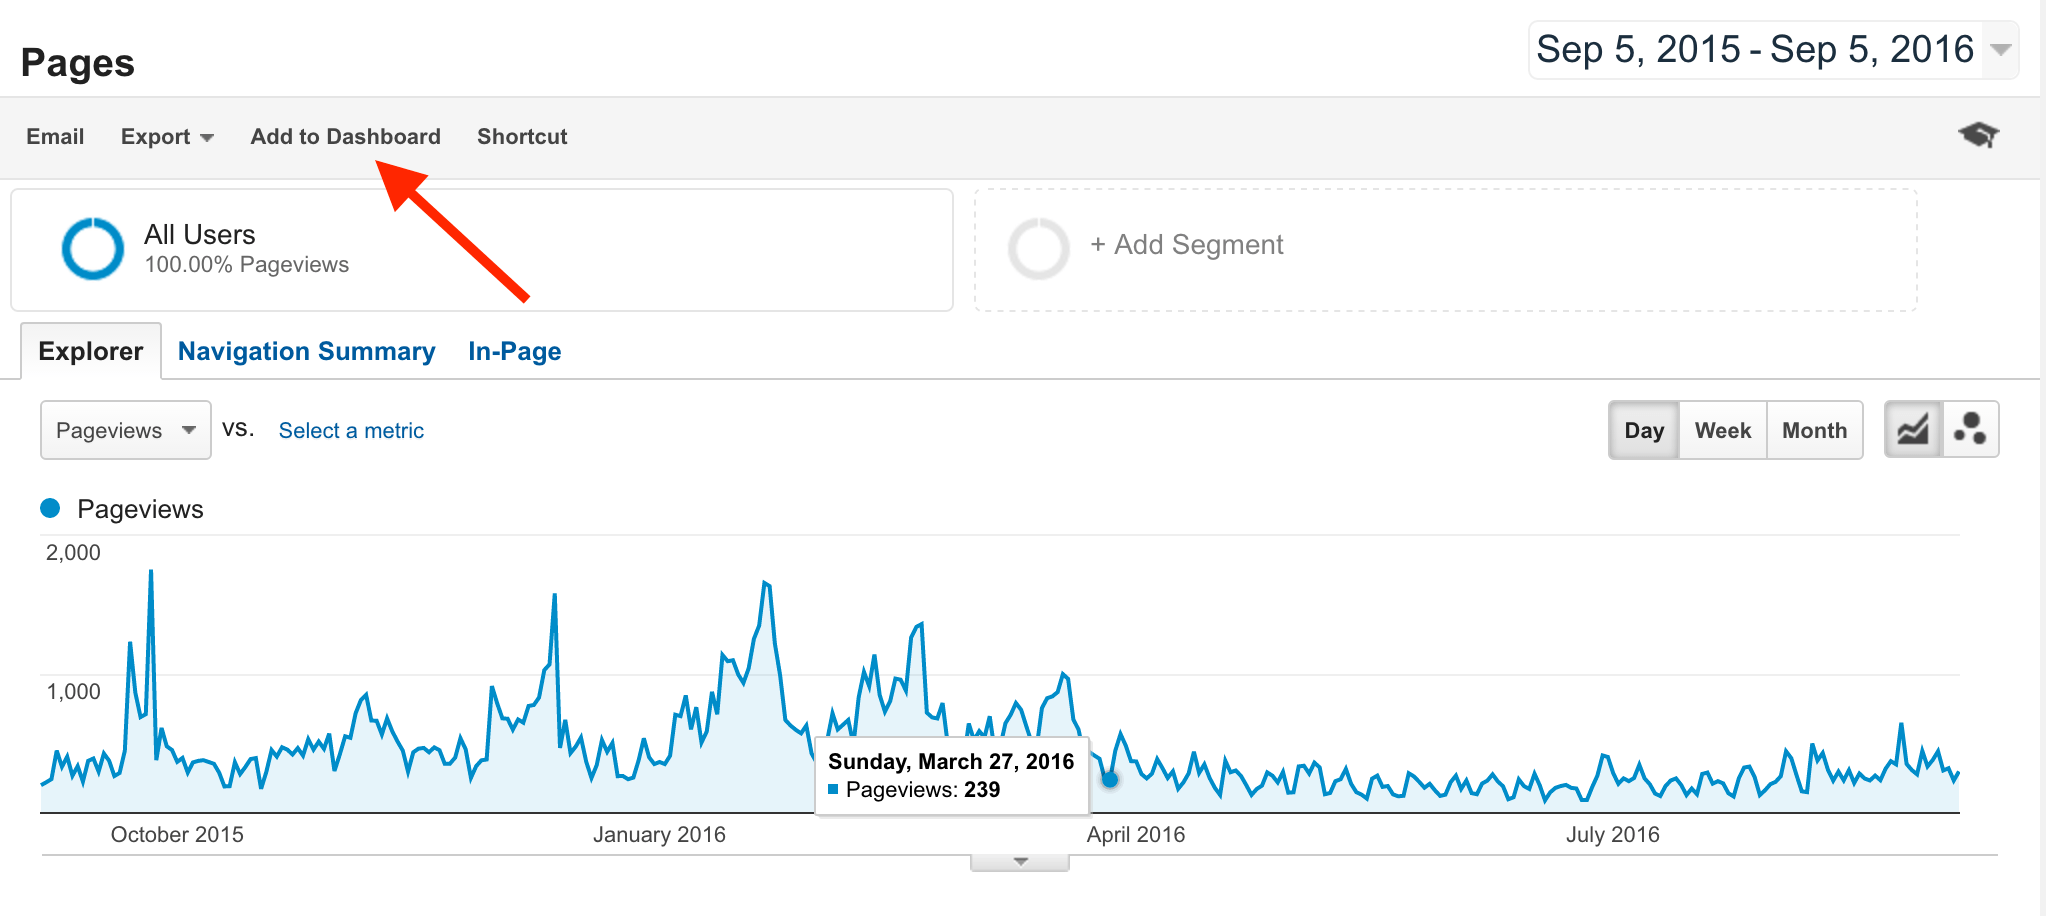
Step 2: Click the Add To Dashboard link at the top of the page
Check that out! Did you ever notice that before?
Step 3: Add it to your Dashboard
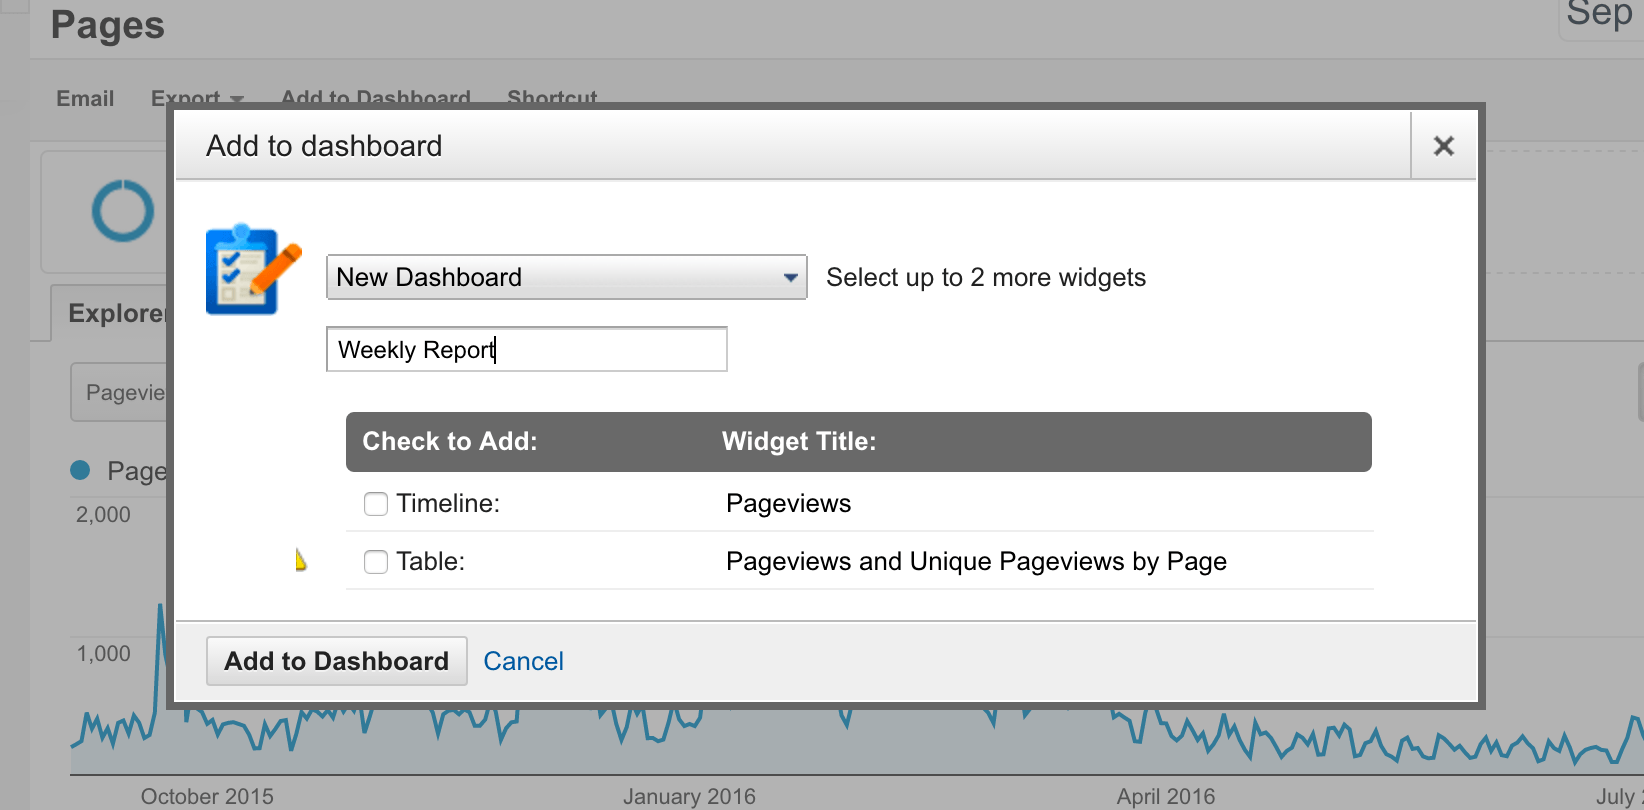
Because you most likely don’t have any dashboards already created, choose New Dashboard as where you want this data to go. For me, I want a timeline view (which is the same as what you would see usually in GA) so I’m going choose that option. Then click Add To Dashboard
After this, it will take you directly to your dashboard that you’ve just created.
Once you’re there, you can customize the look of the dashboard by clicking the Customize Dashboard link in the top right and you can also edit the data that you have in there as well.
Step 4: Share your Dashboard
One of the great things about Dashboards is that you can share them easily. My favorite way to do this is to set up an automated email to the members of my team so that everyone can keep up to date with how things are going. You could also create dashboards for different departments and customize the data to their interests. (For example, you could do one for your Development department with information about Fundraising pages.)
To set up an email, simply go to your dashboard and click the Email link at the top. You will then see this:
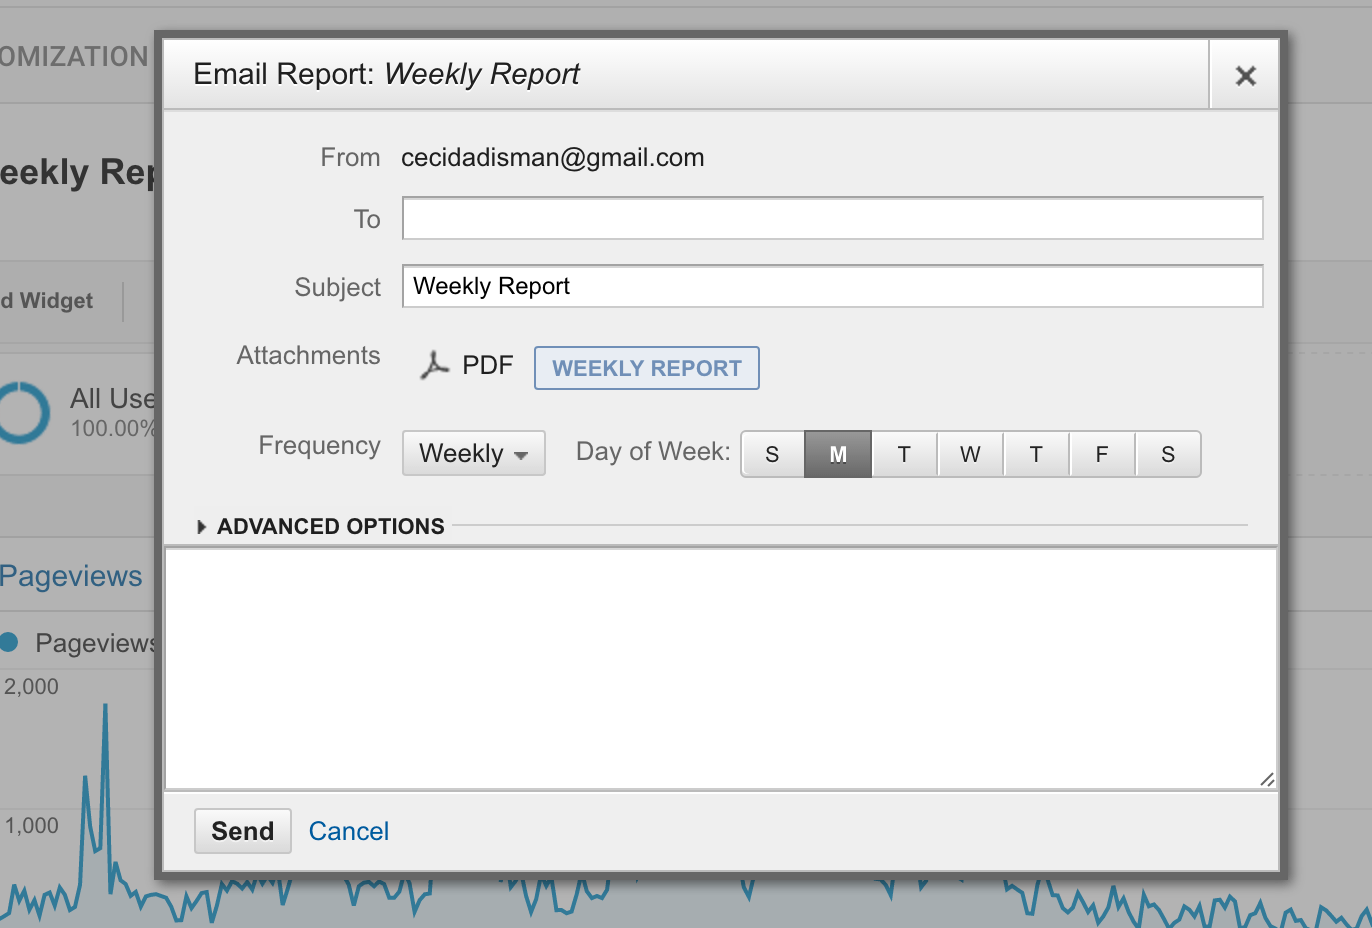
Just fill in the email address(es) of the people you want to get the email and you are ready to go!
Do you use Dashboards already? Share how you use them in the comments below!
