It isn’t a secret that I love data!
The folks at the Nielsen Norman Group have released the latest Total Audience Report which focuses “on telling the story of what’s currently happening across the media landscape for the U.S. consumer.” Basically, it shows how people are using media including TV, video streaming, social media, etc.
Why is this important to arts administrators? Knowing what channels are popular among different market segments help us to target our communications more effectively.
Let’s take a look at some of the data points:

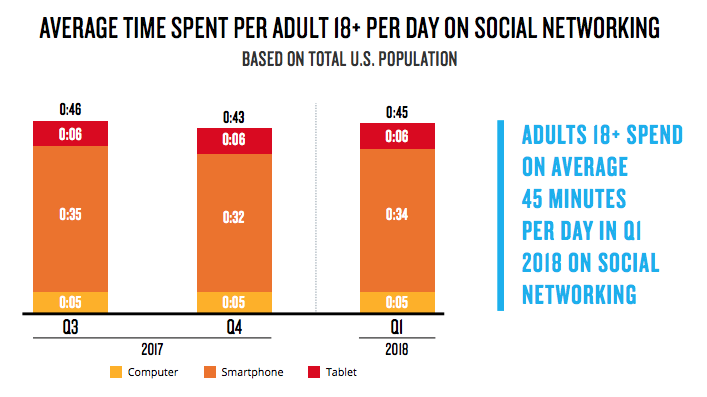
Consider this: According to the Q1 2018 Nielsen MediaTech Trender, a quarterly consumer tracking survey which concentrates on the emerging technology devices and services that are shaping media use today, among adults who view video content within social networking sites/apps, 64% of smartphone users and 46% of tablet users do so at least once per day. Among 18-34 year olds, these percentages are even higher—at 72% and 57%, respectively. This is additional video time that would be added to the almost six hours of total video adult consumers are already accessing.

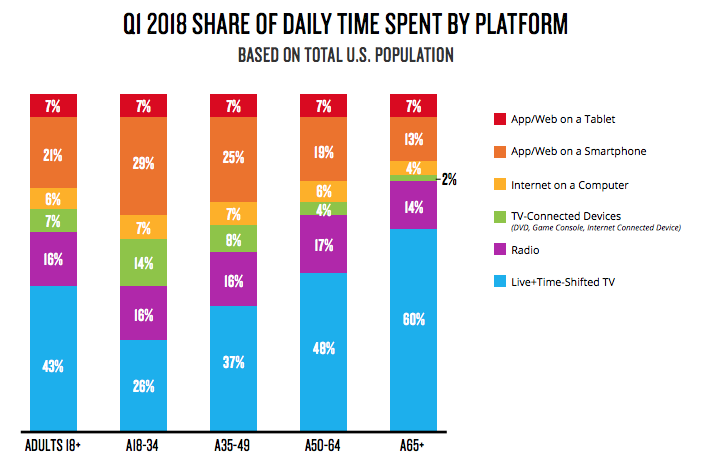
However, in looking at the percent of time people spend with these platforms, a different story begins to emerge. Regardless of age, radio consistently accounts for between 14-17% of daily media use. Adults 18-34 spend more time with digital platforms (43%) than TV and TV-connected devices (40%). Older adults spend more time on live and time-shifted content and less time on TV-connected device use and digital platforms, outside of tablet.