If you know me even just a little, you know that I love data. Especially in the field of arts marketing because we tend to have our own preconceived notions as arts marketers on what “our people” like, what they want, and how they behave. Good data can either back that up or contradict it and put you on the right path.
This is so true with websites. In my travels, I find that most arts organizations are very concerned with how their website looks which is understandable because we are so visual. However, what if that visually stunning website actually hurts your conversion rate or is hard for people to navigate?
I hope that everyone reading this has Google Analytics installed on their site and that you regularly look at the data. (If you don’t, install it IMMEDIATELY. If you do, go and look at the data right now. RIGHT NOW. If you aren’t sure how to read the data, Google has lots of free resources to help you.)
Another way to see how people are interacting with your site is through heatmapping. I’ve had heatmapping installed on the Palm Beach Opera website for the past few years and, I’ve got to say, that I love it. It gives you a different take on the data because you can see not just what content people are viewing, but where they are looking on each page of your site.
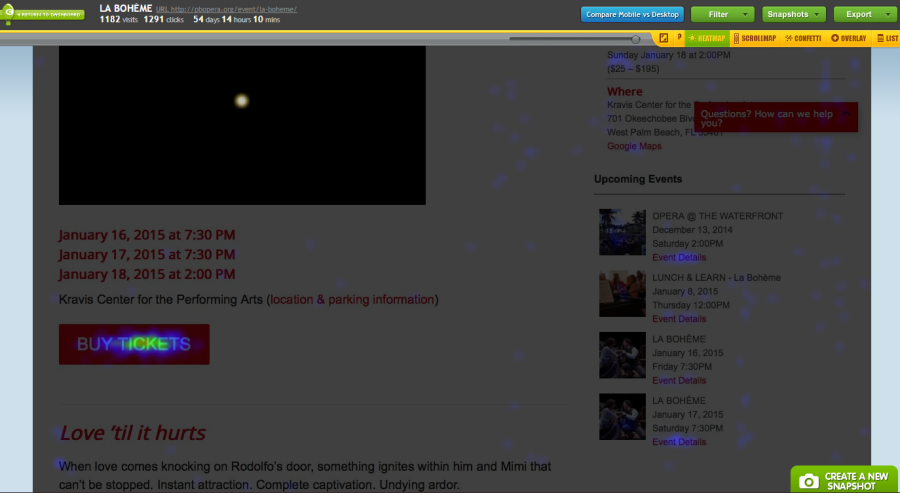
Here’s a sample heatmap:
You don’t have to be some sort of tech genius to see that the Buy Tickets button is performing pretty well here.
My favorite heatmapping software is CrazyEgg.com. You can set up any number of what they call “snapshots” which are really just pages for them to track. Let them fun for a few weeks to see what people are looking at most, or what might be more useful, what people aren’t looking at.
They offer a nonprofit rate and I end up paying about $100 for the entire year which is affordable for even a small nonprofit.
Installation is also quite easy. If you have a website that is built using Wordpress, all you have to do is install their plugin and copy and paste the little bit of code that they give you when you create your account. If you don’t use Wordpress, they’ll give you some code that you can copy and paste (or have your website person copy and paste) into your site’s HTML.

A similar, but not quite as robust, resource is the integrated click tracking built into google analytics: https://screencast.com/t/kmMbbokc
If you’re a Chrome user, there’s an excellent extension that allows you to toggle it on and off from the browser window: https://tinyurl.com/l52khlk. The only real advantage here is there is nothing to install at your website although you do need to have Google Analytics tracking code embedded and active.
CrazyEgg was a lifesaver for our marketing team when we re-branded and launched a new website. Monitoring daily where people click (or want to click) as well as what’s “hot” helped up to be much more fluid and dynamic in how we sold, what we sold and when we sold
I visited the crazy egg site, but I am not clear on how this works. Does it require that people be using a device with a camera so it can track eye movement or does it just track where people point their mouse?
If it is the latter, then you aren’t getting a lot of insight about how effective your website design is in terms of placing things to catch eyes. Mouse cursors are going to obviously orient toward links and videos.
Regardless of how it tracks, what struck me as more interesting is how often people focus on anything that isn’t a video or buy ticket button. You would expect those to be comparatively high use. From the screen shot you provide it appears that the Opera on the Waterfront and Saturday La Boheme are seeing more interest than the Lunch and Learn and Friday Boheme.