Google Analytics (GA) is a remarkable resource but too many arts marketers aren’t able to leverage everything it has to offer. It’s not from a lack of trying or desire; in many cases, GA can simply seem overwhelming; fortunately, Google rolls out a seemingly endless stream of improvements and over the past year, many of those have been geared to one-click-simple changes; case in point, activating demographics and interest reports.
Previously, this little gem required a slight modification to your tracking code which you then had to upload to your site (and there’s still an option for that via the “Admin>Properties>Property Settings” admin panel which will provide a boost to the data) but you can now activate with a single button click.
It’s so straightforward, it won’t take more than 30 seconds to complete. Start off by logging into your GA account…
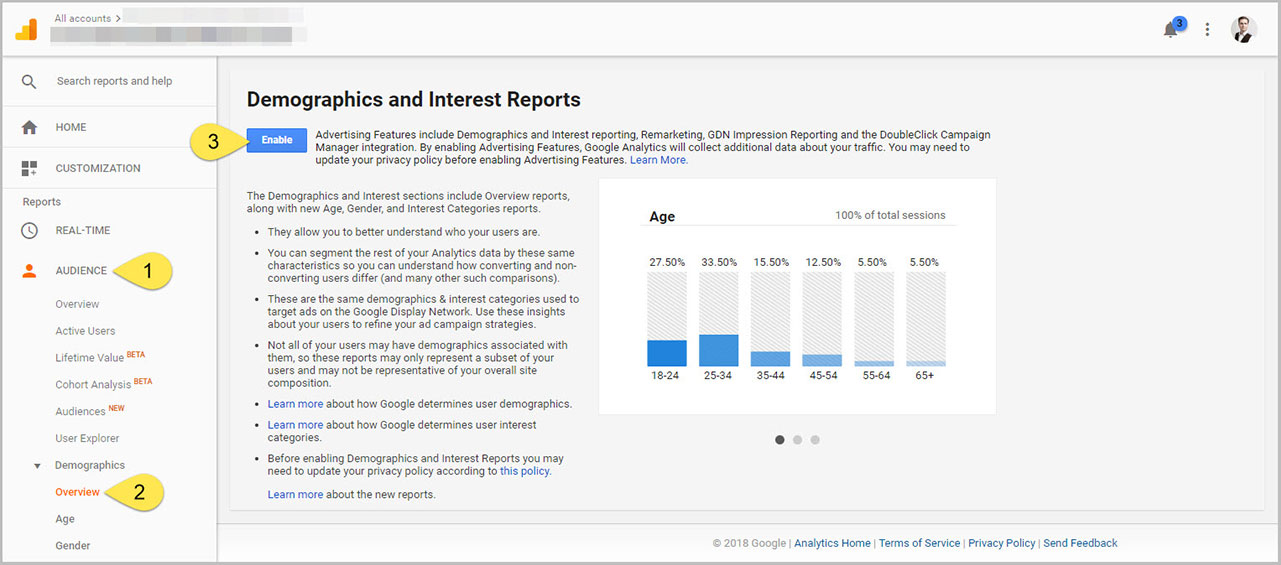
- From the “Reports” panel, open the “Audience” menu item.
- Go to the “Demographics>Overview” admin panel.
- Select the blue “Enable” button.
That’s it.
If all went according to plan, you should see something along the lines of a message saying “Congratulations! You have successfully enabled the Demographic Reports. While you can access them now, it may take up to 24 hours before there is data available in these reports.”
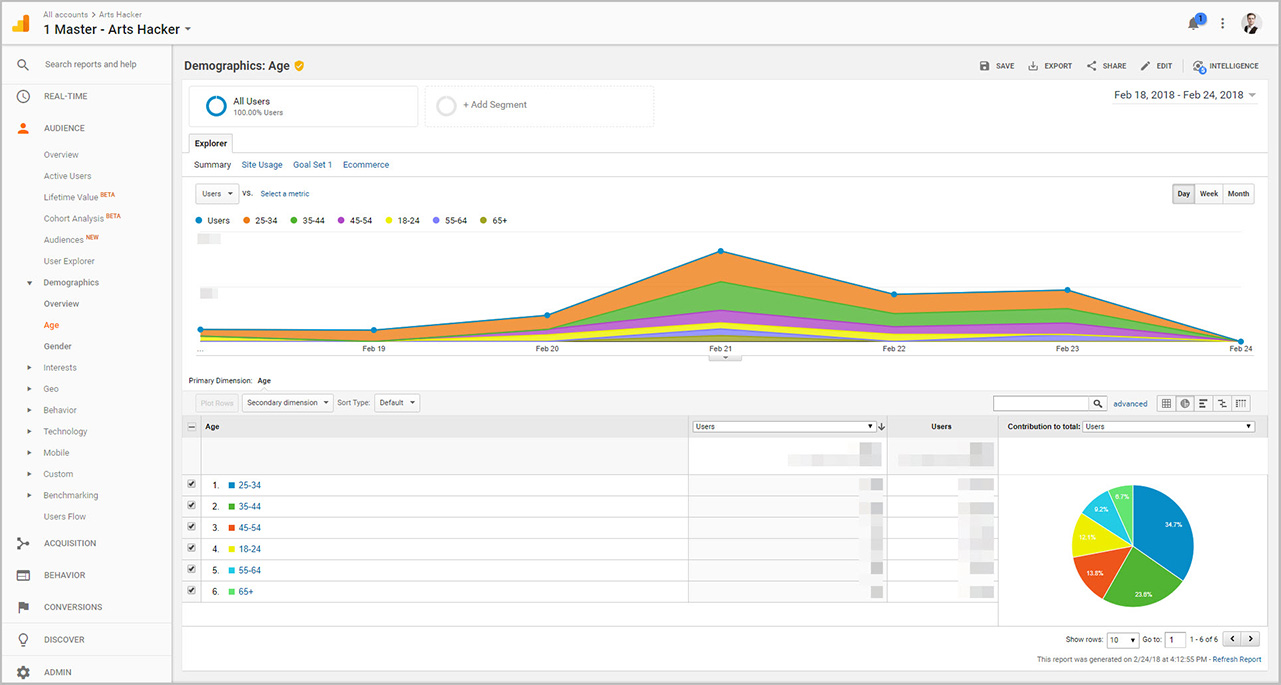
Moving forward, you can return to the Demographics reports over the next few days and begin to see data trickle in. After a few weeks, you’ll be amazed at how much useful data was slipping by under your radar.
If you’re curious about where the data comes from, the difference in standard and custom reports, and how Google defines the ready-made demographic dimensions head over to the related Analytics’ help page, which is genuinely helpful and provides a wealth of info that users with a wide range of understanding can grasp.