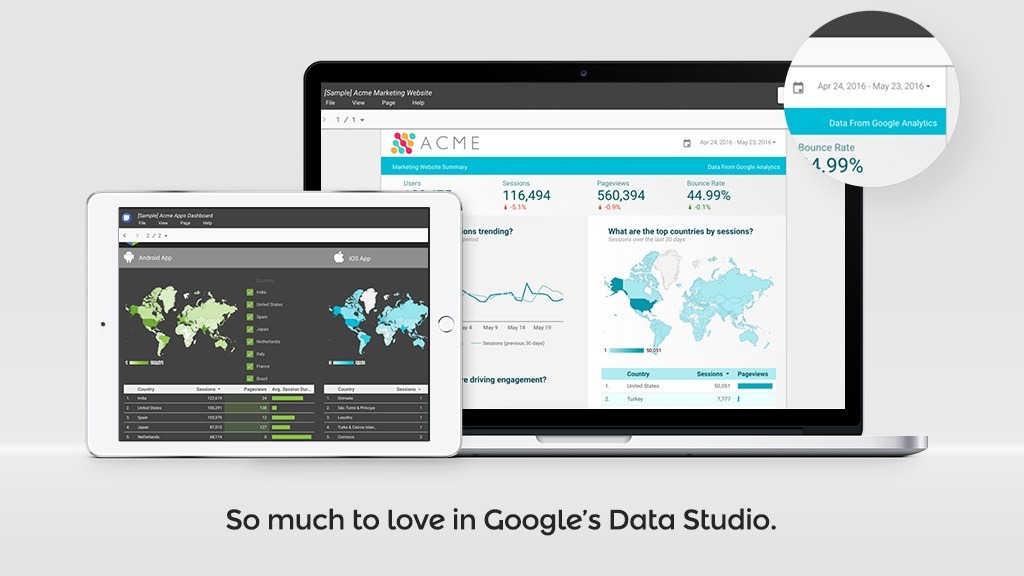
On 5/25/2016 Google launched a free version of their data visualization tool, called Data Studio, which makes it super easy to turn Google Analytics (GA) data into traditional and real-time reports. According to the announcement, “Data Studio lets you connect to all your marketing data and turn that data into beautiful, informative reports that are easy to understand, share, and fully customizable.” After using the product for a short period of time, it was crystal clear that they are delivering exactly what they promise.
In a nutshell, Data Studio feels a lot like a presentation platform in that it has a WYSIWYG design interface but the data is pulled directly from your GA account and updated in real-time. Out of the box, Data Studio will let you not only integrate GA data, but data from your AdWords account as well.

Good Looking Data = Impact
One of the key benefits to Data Studio is simply making your data look good. Nothing is worse than spending time compiling useful metrics data into a spreadsheet only to have your superior or board rep go into eye-glaze mode and miss everything you’re trying to quantify.
Data Center provides two basic color schemes (light and dark) that you can customize the daylights out of to the point where it looks like an in-house branded document.
I was pleased at just how intuitive and easy the layout and design tools were to use but you’ll do yourself a huge favor by watching the five-minute overview video before jumping in and keeping it handy when putting together your first report. Seriously now, don’t skimp on the video, you’ll be grateful for taking the time out of your day.
Once you feel comfortable with everything head over to the Data Studio site, log in with the same Google account you use for GA and Adwords, and go nuts.
Real Time Data
Much like the existing Google Docs suite, Data Studio provides the ability to collaborate on reports and insert data so it can be manipulated in real time.
- Want to change the time frame the report is using to pull data? No problem, you can insert a to/from calendar to edit those date parameters.
- Want to show table based data for all rows based on in descending order from values in the third column? No problem, one click resorts the entire table.
- Need to see a value at a specific point in a line chart? No problem, just hover over that point.
Granted, if you plan on printing out your reports, you won’t get to use that awesome but that’s even more of a reason to convince your boss to invest in a good projection setup with Wi-Fi or hardline connectivity in the conference room.
Thank you for the authoritative read on this issue. To me, being able to actually see the icon in the…