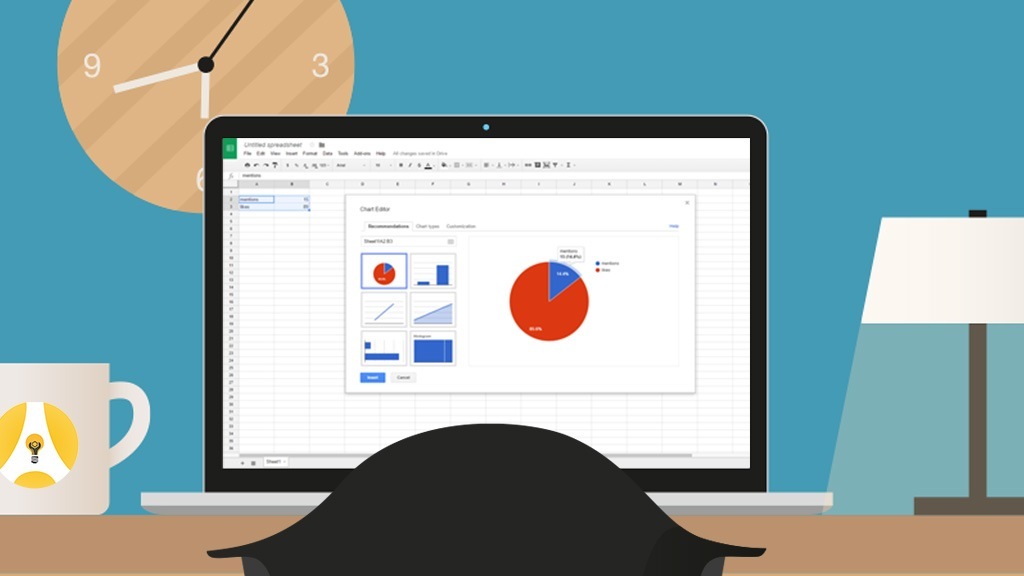
There are some really terrific turn-key products to use for creating a wealth of custom reports not to mention an ever-growing list of providers capable of creating custom reports for dedicated platforms. But what are you supposed to do if those are all out of budgetary reach? Until recently, your only option was to acquire some skills and code those options yourself, but that’s all beginning to change.
We took a look at the connectivity service, Zapier, in an article from January, 2015. In short, Zapier is a service that lets you move data from one platform to another without needing to write any code. It has been a real game changer inside the development field.
Recently, Zapier published a detailed, step-by-step tutorial article on how to go about creating these custom dashboards. It goes a long way toward helping you see not only the big picture but provides enough details to help you adopt their examples to your actual reporting needs.
These options work best with a cloud based spreadsheet, such as Google Sheets but as they point out in the article, you can use local based spreadsheets but it requires manually importing the data. When using the cloud based option, you can even push data into existing sheets to auto-update values and have those changes pushed into your existing charts automatically.

Some real-world examples to consider include options for single data sources or even combining sources into a single dashboard:
- Creating dashboards for Eventbrite, PayPal, or a variety of ecommerce based transactions (both standard and pro accounts). Think donations, merch, memberships, ticket purchases, etc.
- Creating dashboards showing your new email marketing account subscribers (and for some providers, unsubscribes).
- Creating dashboards for tracking social media activity (see Twitter mentions alongside likes, or new Twitter and Instagram followers, and new FB ad leads).
The Zapier article includes an extended section that uses pulling data from Google Analytics (GA) into a spreadsheet, but reporting and dashboards inside GA are likely more than adequate for your needs so I recommend skipping that section entirely.
In the end, these tools not only make it easier for you to visualize data but it provides new options for illustrating everything to co-workers and board members.
Unless you need to use a premium app (such as PayPal or Facebook), Zapier’s free account will work just fine. And for groups with the tightest of budgets, every new tool you can use that doesn’t cost a fortune nor require a steep learning curve, is worthwhile.