In order to get the most out of your optimization efforts and counteract post net neutrality slowdowns, you need to have a reliable starting point to use as a frame of reference. That process begins with taking a series of page speed performance benchmark snapshots.
To that end, there are several powerful tools available that are also free to use. The first two offer free user accounts that come in handy when you want to save test histories to reference down the road. You can’t make a bad choice and I recommend you use all three at some point in time.
[box]
WebPageTest.org
Most detailed results, most advanced test settings, visual image display on waterfall results. Allows for multiple test passes to generate median test results.[/box][box]
GTmetrix.com
A solid mix of intermediate to strong test settings and results but not as complicated to configure and use as WebPageTest. Unique feature includes displaying multiple tests side-by-side (super handy for comparing two different sites or multiple pages inside the same site).[/box][box]
Pingdom.com
Easiest to use but far less detailed results and hardly any custom test settings.[/box]
Setting Up Your Tests
WebPageTest.org
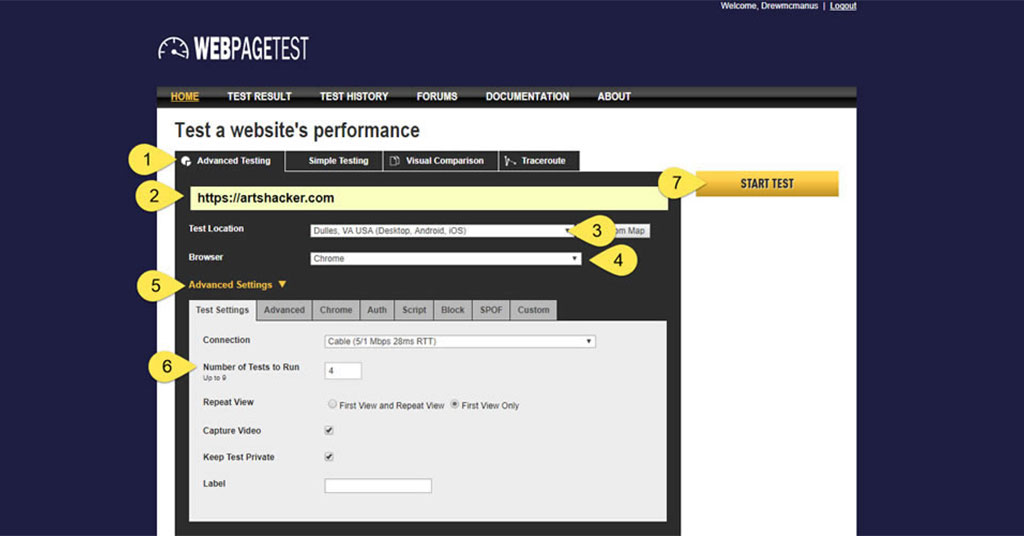
- Select the “Advanced Testing” tab.
- Enter the full, primary URL for your site.
Important: be sure to include the correct protocol (http or https) and www or non-www sub domain version. Using the wrong one will add any redirect time those generate to your result score. - Select a test location in your country.
- Select browser. For most tests, opt for one that matches the browser used on your machine but do notice that you can select mobile browsers as well, this can be a handy tool for mobile troubleshooting.
- Toggle open the “Advanced Settings” panel.
- I recommend setting the “Number of Tests to Run” to “4” as this will give you a more reliable average score in the results (not to mention help identify any potential server inconsistencies).
- Select “Start Test” button when ready.
GTmetrix
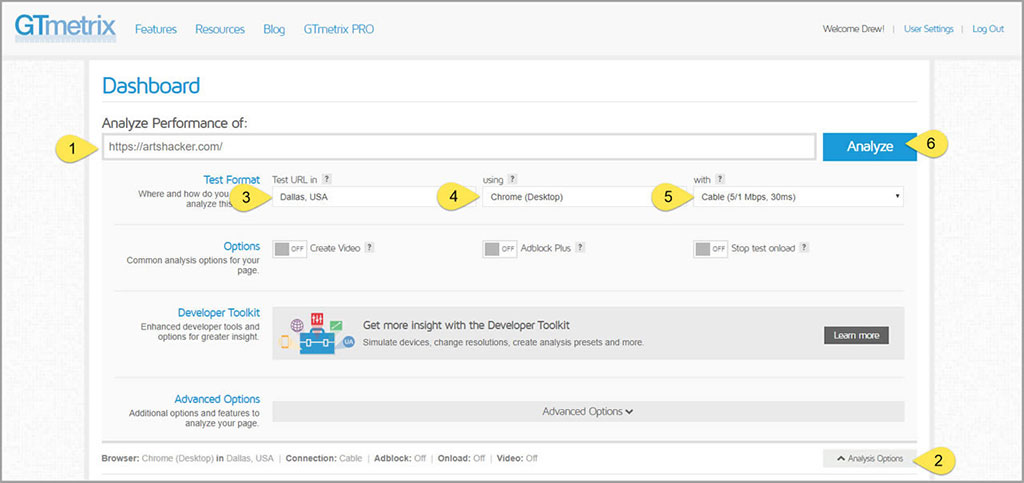
- Enter the full, primary URL for your site (same warning here as above).
- Toggle open “Analysis Options.”
- Select location to test URL. There are fewer options here than WebPageTest, but you should select a location in your country.
- Select browser.
- Select the testing speed. The default Cable 5/1 Mbps is usually fine but if you know your connection speed and see an option the better represents, select that. You can also test other connection speeds such as 3G mobile.
- Select “Analyze” button when ready.
Pingdom

Pingdom is by far, the easiest to use thanks to the lack of configuration options. At the same time, those lack of options make it less useful if you need to test specific conditions.
- Enter the full, primary URL for your site (same warning here as above).
- Select test location (select one that matches your country).
- Select “Start Test” button.
[box]Pro Tip: although these examples used the homepage for your website as the test URL, you can use any URL from your site. I strongly recommend you test all high traffic and/or critical pages at your site.[/box]
Processing Results
WebPageTest.org
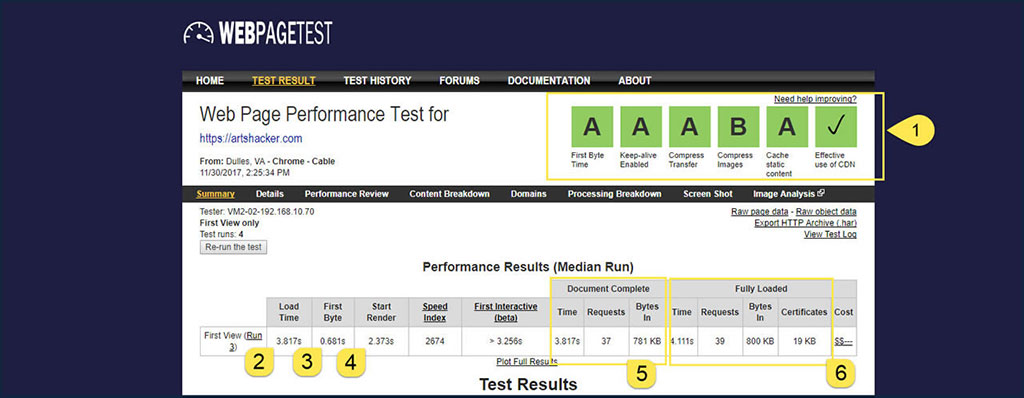
Don’t get startled by the data dump level of results. Although it’s all useful, you don’t need to sift through each piece. Here are the areas you should focus on for this work:
- Performance Grades. These overall scores for each category can be clicked where you’ll be taken to more details about what generated that grade. In this instance, if you clicked the score for “Compress Images” you arrive at a page which provides a breakdown of results and recommendations. For this category, the results would be handy for identifying any images that would benefit from optimization. The actual letter grades are a bit subjective, but you should investigate improving anything with a score of C or lower.
- Load time: evaluates the amount of time it took the webpage to fully load all content.
- First byte: evaluates how long the first bite of data is delivered to the browser. It’s handy to think of this as the time it takes for the server to respond to a visitor’s computer.
Tip: long first byte times are a good indication that there’s a potential issue with DNS routing or the site has too much autoloaded data (something we’ll cover in the impending database optimization installment). - Start Render: this is how long it takes before most page visitors “feel” like it’s being loaded by the browser.
- Document Complete: results include the Load Time value above along with the total number of requests and the size of the page content.
- Fully Loaded: results are similar but include some additional content that doesn’t interfere with a visitor’s user experience. These results are usually a little higher than the Document Complete values.
We’ll examine the detailed test results section below.
GTmetrix
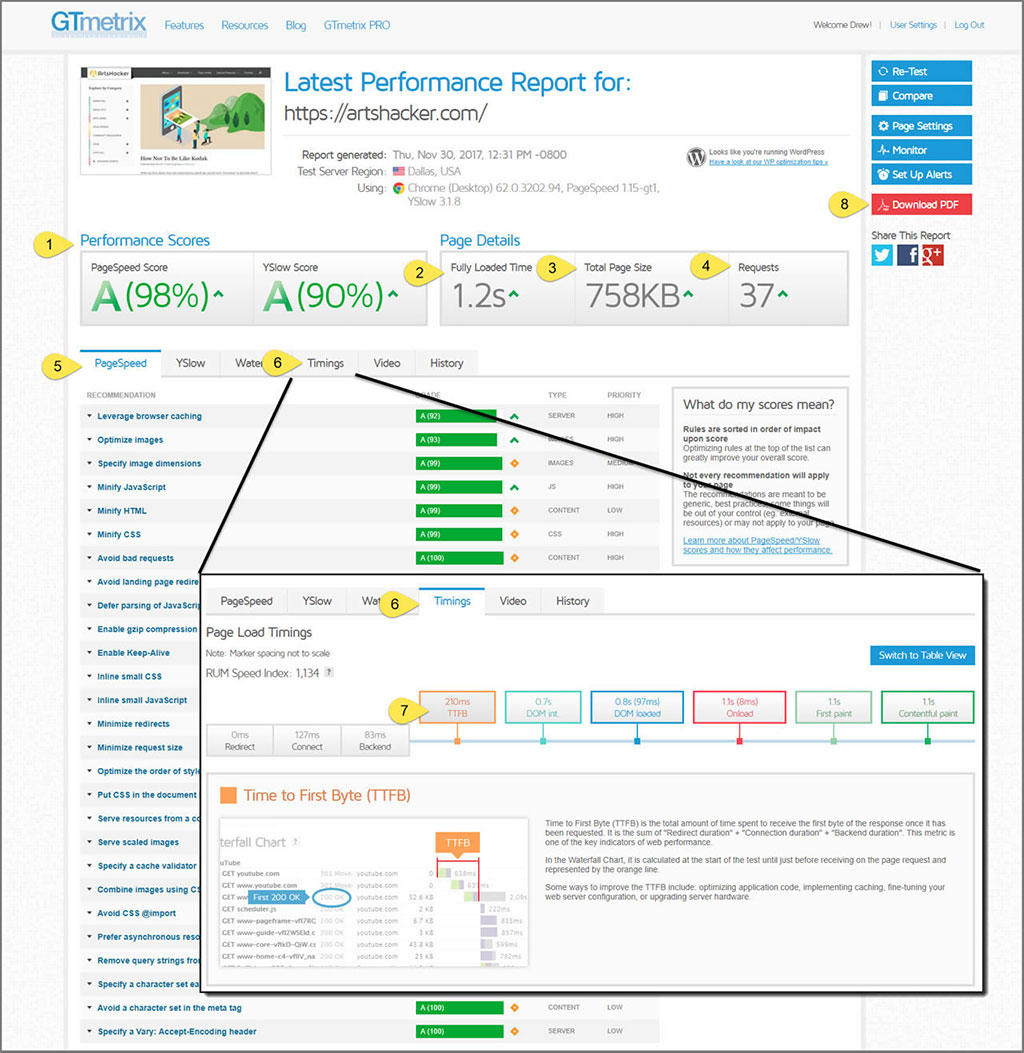
Compared to WebPageTest, these test results are more user friendly. Using the areas of focus from WebPageTest as a guide, here is where you’ll find comparable result data.
- Performance Scores. GTmetrix evaluates page load speed using two services: PageSpeed and YSlow. Both services analyze a page using a set of rules that they believe are most relevant to page speed and performance. Most of the rules overlap or are very similar to each other, but in general your scores should be comparable. GTmetrix maintains a recommendations reference page with more info on each service’s best practices. I tend to place higher actionable value on PageSpeed results.
- Fully loaded time. A green up-arrow or red down-arrow indicates how your site compared to other sites GTmetrix has been analyzing over the past 30 days.
- Total Page Size. This value should be similar to the “bytes in” value in WebPageTest’s “Document Complete” results section.
- This value should be similar to the “requests” value in WebPageTest’s “Document Complete” results section.
- By default, the PageSpeed tab will be selected, category results are listed in descending order. You can toggle open any section for more information; GTmetrix does an excellent job at providing tooltips inside each section to help you better understand the results and how they impact site performance.
- The Timings tab will provide additional info on key load time.
- Time to First Byte value. Another nice benefit of GTmetrix’s user interface is you can hover over each result and a detailed help file appears below. It not only describes why the information is useful, but it will show you where in the waterfall it is found (we’ll cover waterfall results below).
- Don’t miss the handy “Download PDF” button. This is very useful if you need to share results in a meeting or just want to keep test results handy on your local machine.
Pingdom
Pingdom provides much, but not all, of the same info in a simplified format.
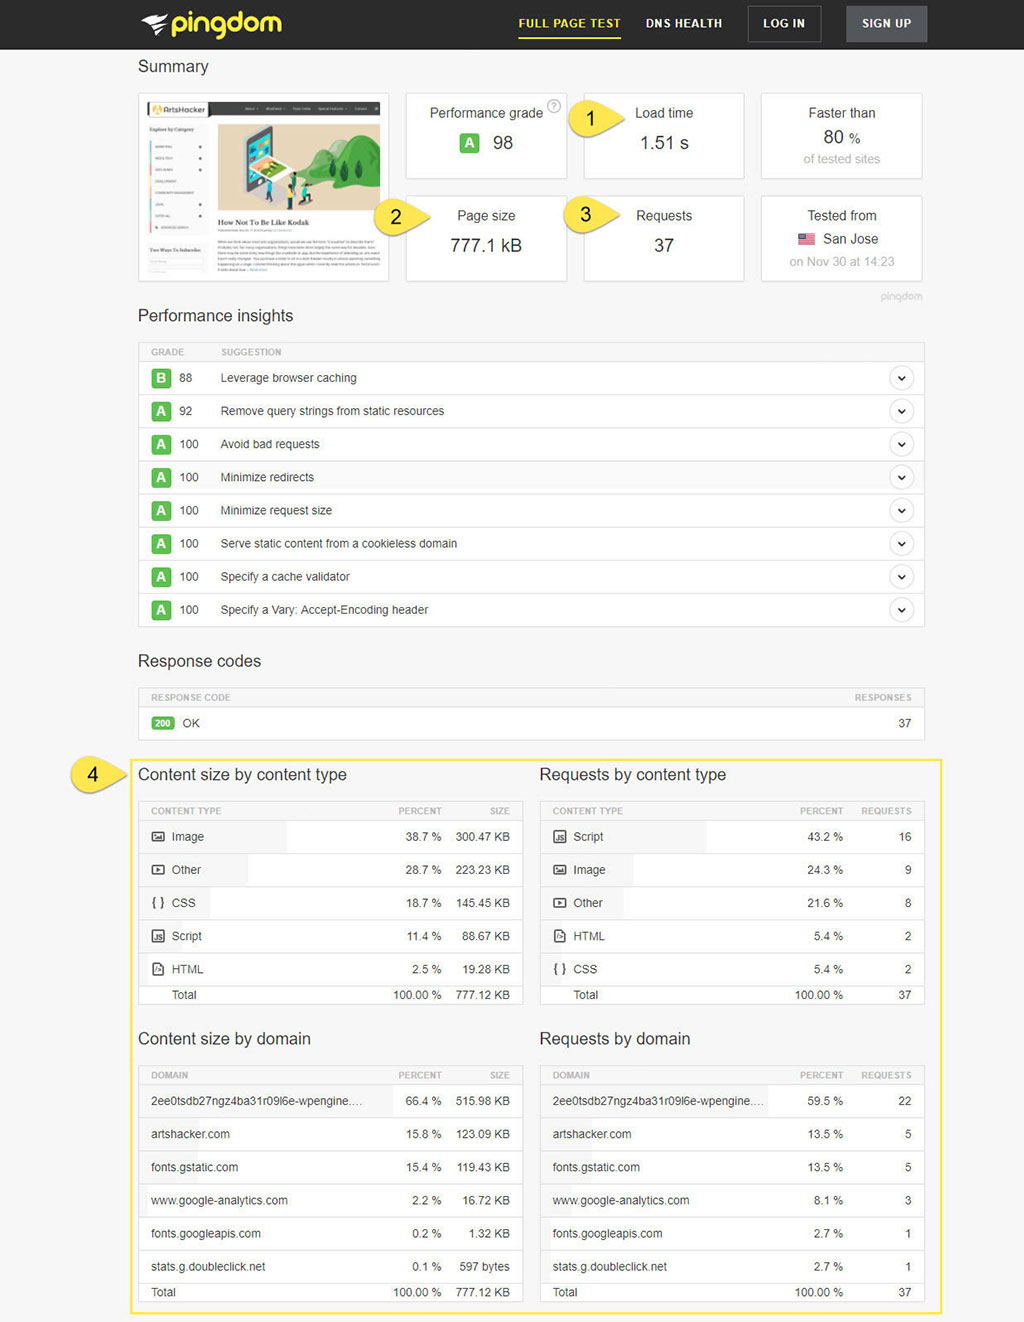
- Load time.
- Page size. This value should be close to the “Total Page Size” value from GTmetrix and “bytes in” value from WebPageTest.
- This value should be close to the similarly titled sections in GTmetrix and WebPageTest.
- This condensed data overview section is a unique offering from Pingdom. It provides cumulative values for content and request types along with showing which domains certain types of content are coming from. The latter are especially useful in quickly identifying any unknown advertising scripts along with off-server resources (like fonts).
Waterfall Results
This is where you’ll get your crazy useful analysis mojo going.
Ideally you want your Waterfall to be as narrow (quick overall load time) and short (small number of elements to load) as possible.
Having said that, you’ll want to balance this against the amount of feature rich content you have on any given page. In addition to user experience elements, items such as Google Analytics, tracking pixels, etc. will conspire to make your Waterfall thicker and longer.
In the end, balance is your goal in a steep Waterfall (longer, but a sharp drop off to the right) with more parallel element loading going on.
For this section, we’re going to focus exclusively on the Waterfall results from WebPageTest. The other two options provide very similar experiences but WebPageTest offers a few treats that should make it your go-to option for waterfall analysis.
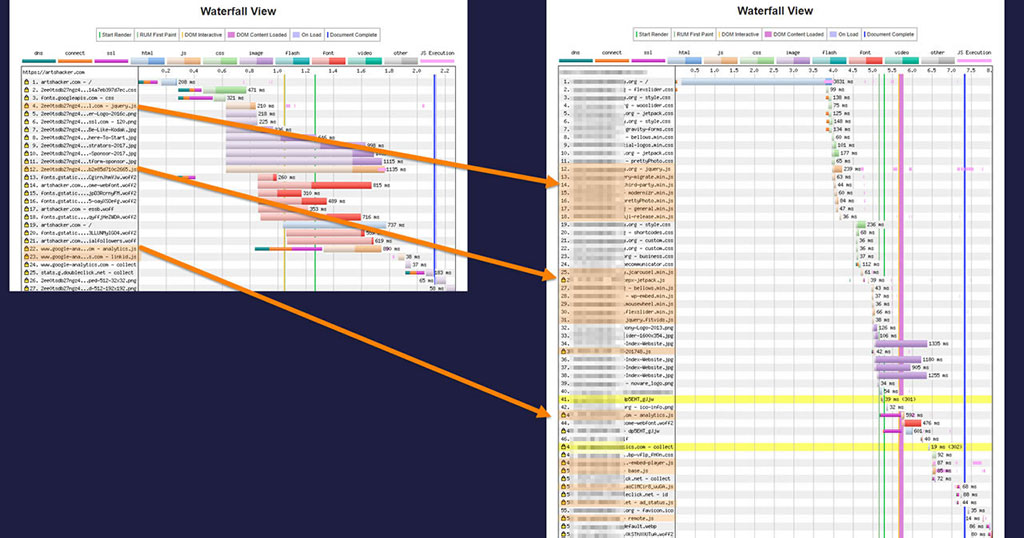
For frame of reference, here are results from two different sites displayed side-by-side. The one on the left for ArtsHacker shows a desirable Grade, Performance Results, and Waterfall pattern. The site on the right (we’ll call it “Brand X”), not so much.
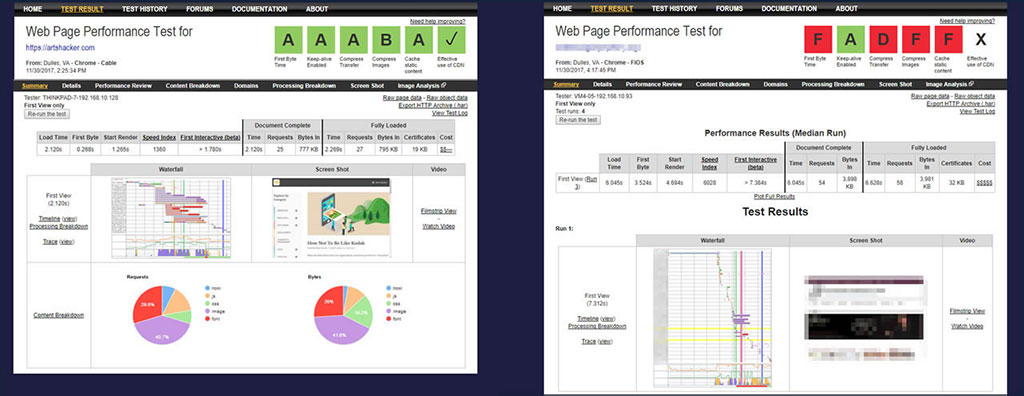
Clicking anywhere on the Waterfall will load the detailed Waterfall results page.
It’s worth mentioning at this point you can go into a tremendous amount of detail with what you want to analyze. For the purposes of this article, we’re going to focus on items that have the most impact on page speed which are simultaneously easier to turn into actionable results, regardless your skill level.
Long and Differential Length Load Times
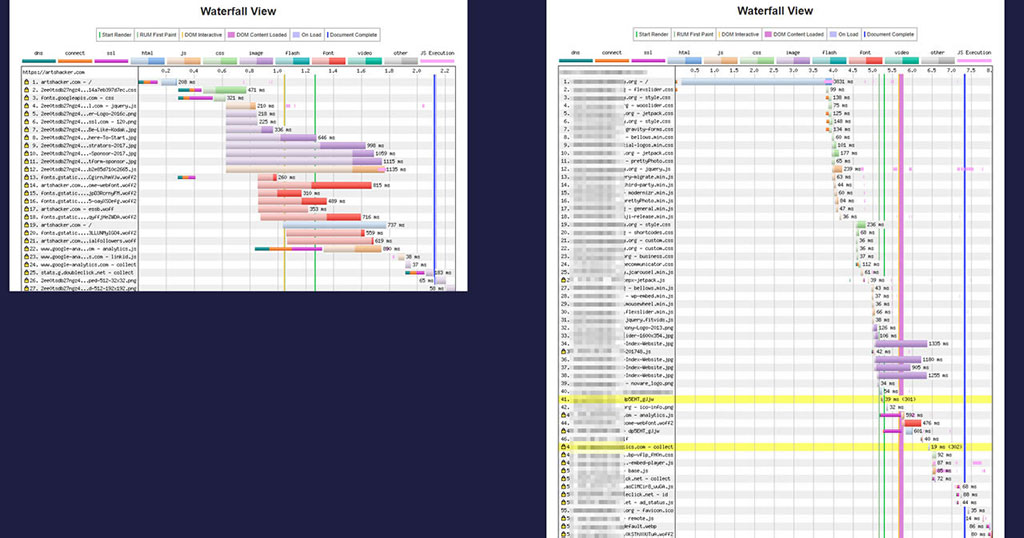
On the ArtsHacker Waterfall, there are no individual items that stand out from others in load time. Likewise, all the elements that took the longest time to load were nearly the same length of time.
For Brand X, the first item that jumps out is the very long bar for Row 1, you’ll notice the overall time value (3.831s) is nearly the same length as the “First Byte” value (3.788s). Remember when we mentioned this as a good indication that there’s a potential issue with DNS or autoloaded data? This is a perfect example of a result indicating that exact problem.
Moving on, you’ll notice a large variance in all the short length element load times (green and tan bars) mixed in with the longer elements (purple bars).
Number Of Load Elements
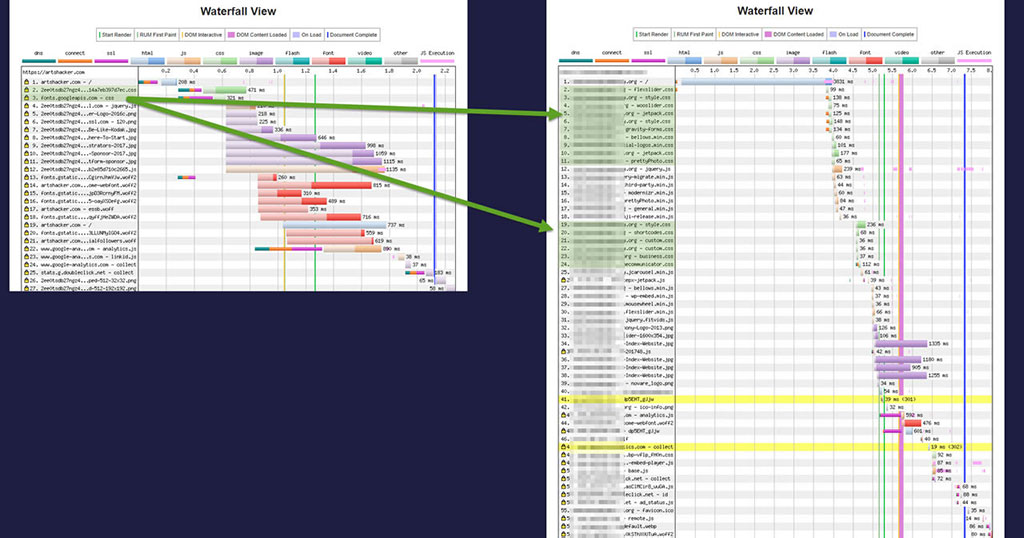
The Waterfall shows you that Brand X has 16 different CSS files loaded in segments that load at broken up periods. Compare that to ArtsHacker’s two, which are loaded one right after the other, and you can see cause for concern if your site’s Waterfall results more closely resemble Brand X.
The very same observations can be said about the JavaScript files:
Remember talking about the balance between number of elements and creating a feature rich user experience? Ironically, the ArtsHacker site is considerably more feature rich than Brand X, but the reduction of overall elements loaded means it runs much faster. Sorry I can’t point out the URL so you can see firsthand (not to mention that would be a real #DickMove), but just trust me on this one as it is from a performing arts org.
If you see a similar number of individual .css and .js files in your site’s Waterfall, don’t panic.
A future installment in this series will show you how to minify those into fewer, leaner numbers of elements (which is exactly how those results were achieved on the ArtsHacker site).
Images
The final Waterfall item we’re going to examine are images and this is where WebPageTest’s tools shine.
By and large, images will be the most likely items to produce longer load times in your waterfall results. Selecting an image row will produce a pop-up with fours tabs of information: Details, Request, Response, and Object.
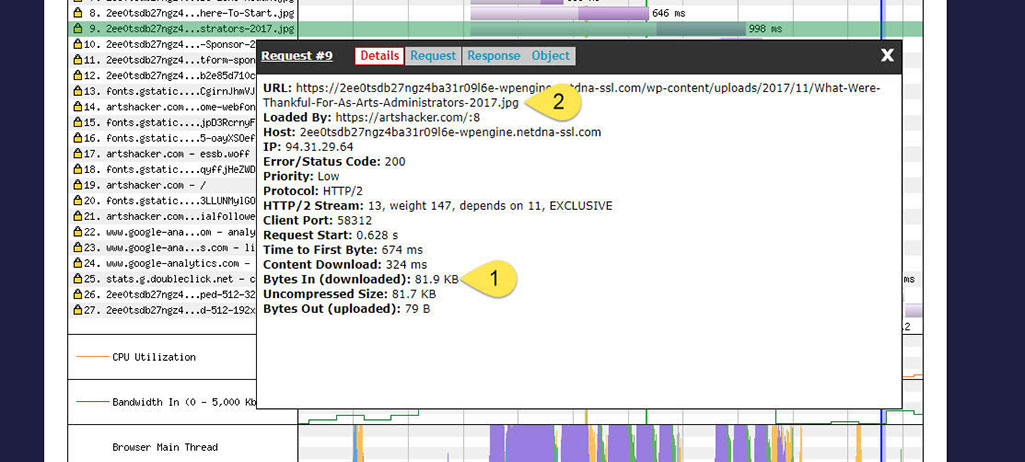
- In the “Details” tab, look for the “Bytes In (downloaded)” value. This will tell you the image file size and is a quick and easy way to see if anyone has been loading unoptimized or (gasp) print quality images. In this case, 81.9KB is a good size. Although max file sizes depend on how the image is used, a good rule of thumb is to keep them under 100kb as much as possible.
- The URL value will provide the image file name, which will help you track it down inside the content management system.
Of course, wouldn’t it be great if you could just see the image, right? Lucky you…
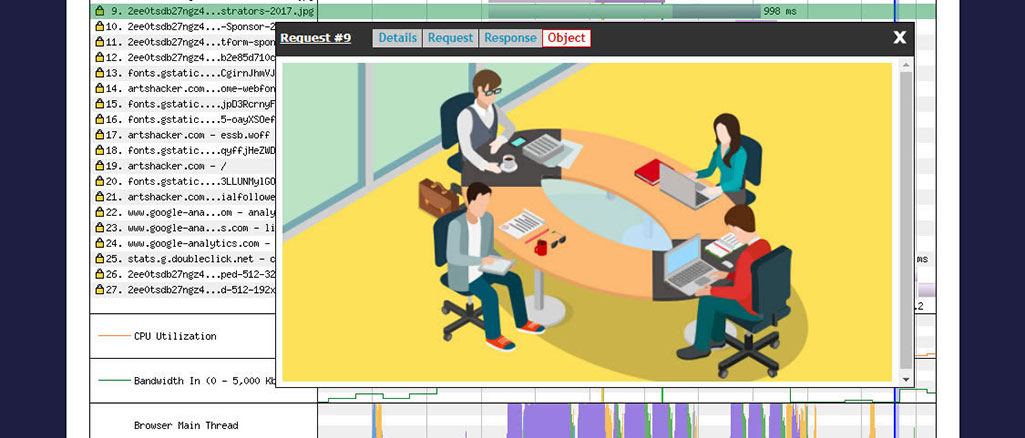
Flip over to the “Object” and you’ll get exactly that. Cool, right?
This is an especially nice Pro Tip shortcut if you weren’t the admin who uploaded the image to the system.
Conclusion
Congratulations! You now know how to run and process page speed tests.
Future installments will cover a wide range of topics, from beginner to advanced skill sets, you can use to improve your site’s page load speeds and have a tool to fight back against potential post net neutrality slowdowns.
Better yet, I can promise you’ll continue to draw on this skill set throughout the length of your career to continuously monitor and tweak your site performance.
Now go take an extra mid-day break, you deserve it.